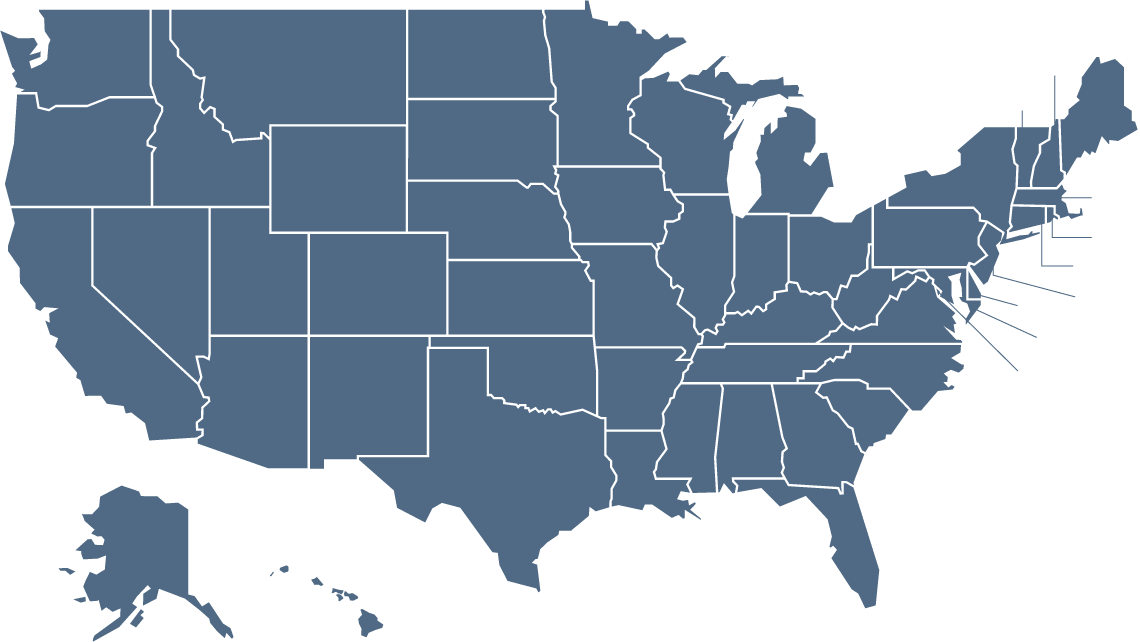
States Crime Map

The data figures that are shown in the map express the most current information retrieved from the FBI’s public database. We’ve summarized it all here for you to get a comprehensive picture of your state's safety when compared to its neighbors.

Select the type of crime you want shown within a period of your choice

All Crimes

The crime map below shows the performance of each state in terms of All Crimes for the Year 2018. Simply hover over any state for more detailed crime figures.

Safetymap 4
110K
12K
190K
30K
46K
90K
140K
90K
350K
38K
230K
170K
310K
44K
30K
300K
170K
61K
97K
180K
20K
150K
210K
120K
79K
300K
18K
290K
130K
130K
230K
20K
180K
19K
230K
800K
83K
9.1K
250K
32K
160K
31K
100K
1.1M
110K
19K
27K
67K
570K
89K
160K

Top Security Companies in Your Area

Protect Your Home
Call now for a free quote
888-389-2987
Adt logoa

Six-Month Money Back Guarantee on all Protect Your Home Packages! 888-389-2987


ADT Authorized Premier Provider. Call now for a free quote 888-389-2987. Protect Your Home provides true nationwide monitoring with 335 call centers all around the country.

Protect America
Logo protectamerica
Vivint
Vivint logoa
Frontpoint
Frontpoint logoa
Link Interactive
Link interactive logoa